Easy Retail Flow › Main › Dashboard
¶ Dashboard Overview
Business intelligence and real-time operational overview for owners and managers.
¶ 1. Command Center Overview
The Dashboard serves as the primary command center for Easy Retail Flow, providing a consolidated view of your business's health across all retail locations.
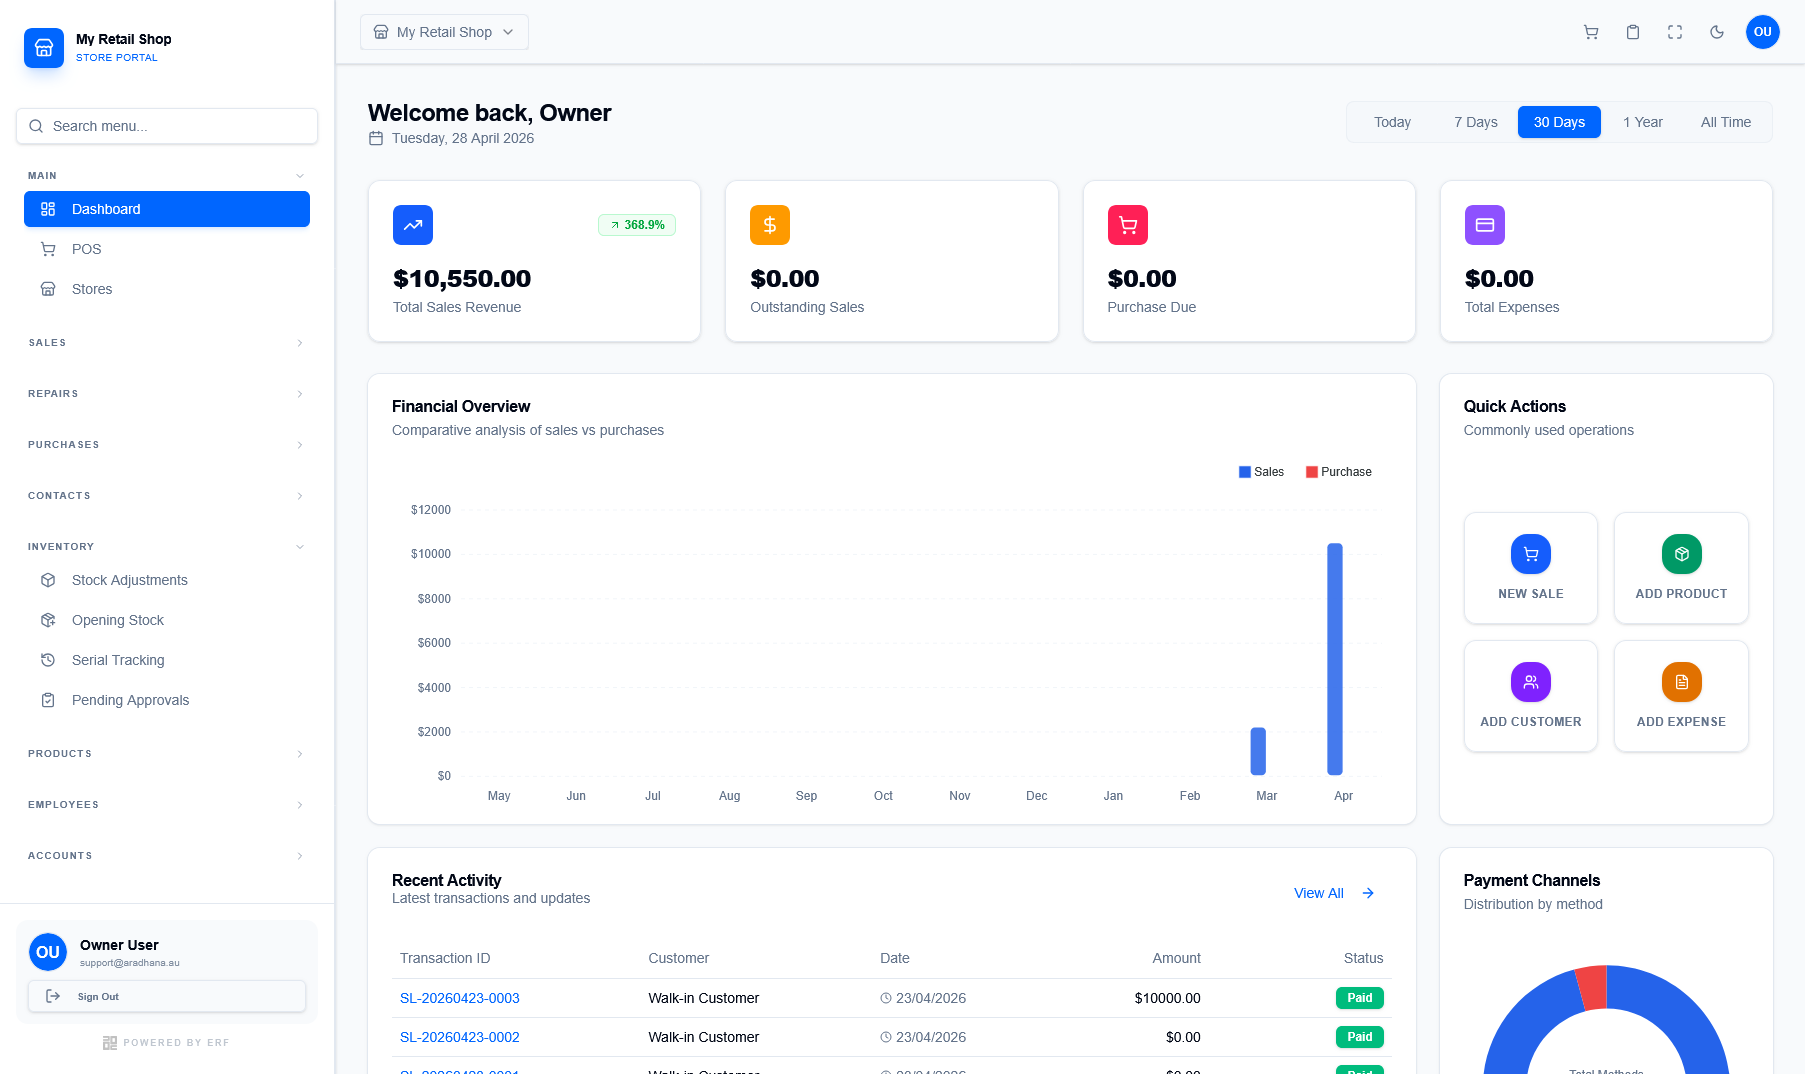
Figure 1 — The main dashboard featuring real-time KPIs and financial charts.
¶ 1.1 Real-Time KPIs
The top section displays critical performance indicators that can be toggled by time period (Today, 7 Days, 30 Days, etc.):
- Total Sales Revenue: Gross revenue generated from all POS transactions.
- Outstanding Sales: Payments pending from credit sales or quotations.
- Purchase Due: Outstanding balances owed to suppliers for procurement.
- Total Expenses: Cumulative operational costs recorded in the system.
¶ 2. Visual Analytics
Detailed charts help you visualize trends and operational distribution at a glance.
¶ Financial Overview
A multi-series bar chart comparing Sales vs Purchases. This allows you to track profitability and inventory investment trends over the fiscal year.
¶ Payment Channels
The donut chart breaks down your revenue by payment method (Cash, Card, Online, etc.), helping you understand customer behavior and reconcile accounts.
¶ 3. Operational Quick Links
Use the Quick Actions panel on the right to perform common operations without navigating through the full sidebar menu.
| Action | Primary Purpose |
|---|---|
| New Sale | Launches the POS interface for immediate transaction processing. |
| Add Product | Quick access to the product creation wizard for new inventory. |
| Add Customer | Registers a new customer to the global CRM. |
| Add Expense | Records an operational cost (e.g., rent, utilities) for financial tracking. |