¶ Overview
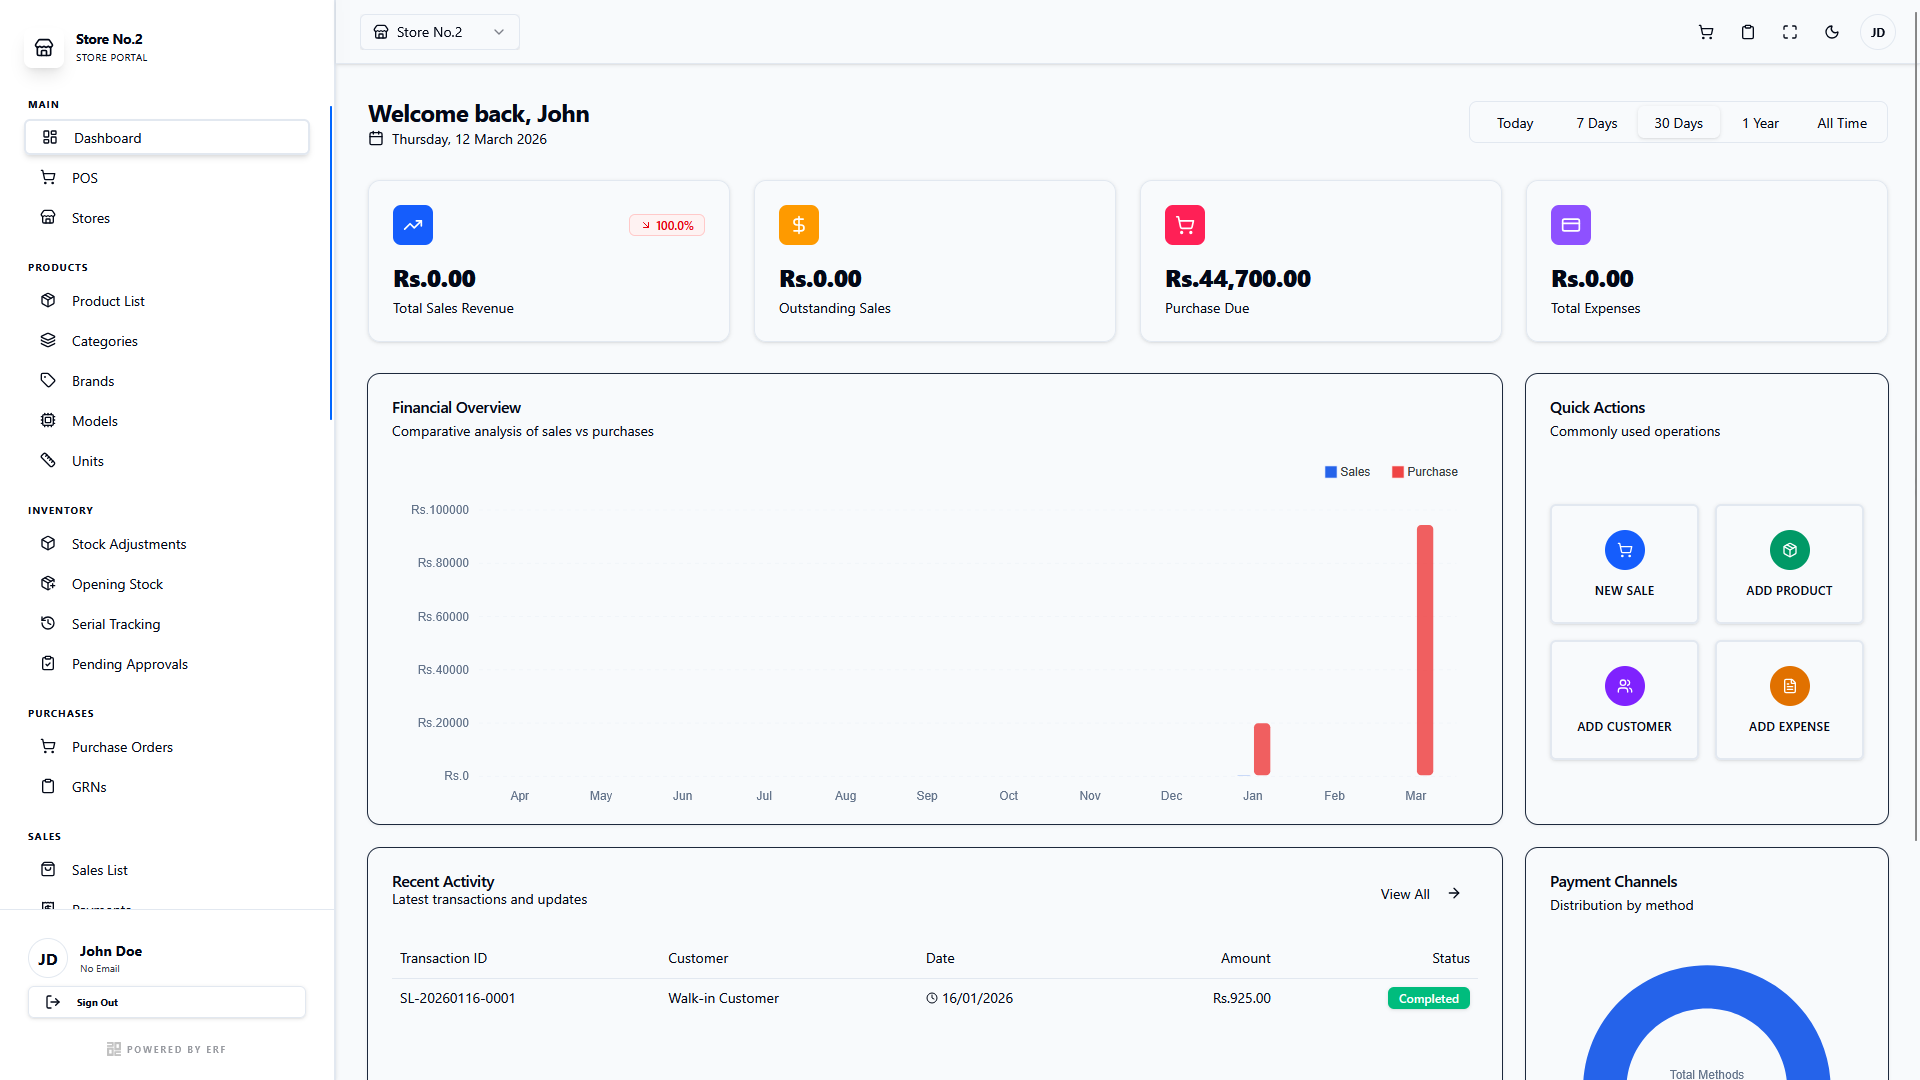
Figure: Actual view of the Dashboard in Totalclient.
The Dashboard is the command center of Totalclient, providing a high-level view of business operations. It consolidates data from sales, inventory, and expenses into actionable insights.
¶ Core Analytics Components
¶ Financial Summary
Real-time tracking of critical totals:
- Total Sales: Gross revenue from all completed transactions.
- Total Income: Net income factoring in payments received.
- Total Expenses: Operational costs recorded in the system.
¶ Operational Metrics
Detailed volume tracking:
- Order Counts: Daily/Weekly volume of POS transactions.
- Purchase Volume: Insights into procurement activity.
- Inventory Alerts: Quick indicators for low stock items.
¶ Data Visualization
¶ Top Selling Products
The dashboard lists your best-performing items with the following metrics: